View Menu > Graph View > How the limits are used when Temprecord displays data
The appearance of the values view, statistics view, and graph view is affected by the display upper and lower limits:
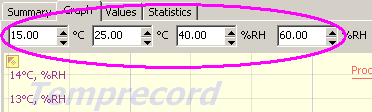
These controls are visible whenever the graph, statistics, or values view tabs are displayed.
When using the lower and upper limit temperature and/or humidity values you need to bear in mind the following:
•The display upper and lower limits for a data window that has data freshly read from the logger are always the same as the logger's programmed lower and upper limits.
•If you adjust the lower and/or upper limits in a Temprecord data window the data in that window is altered to reflect the new limit value. If the statistics view tab is displayed, any statistics item that is dependent on a limit (e.g. time above upper limit) will change to reflect the new value for the limit.
•When you alter the lower and/or upper limits in a Temprecord data window, that change is 'local' to that window. The limits programmed into the logger are not changed, and the limits as set in the default options are not changed. The limits used to display the data in other Temprecord data windows are not changed, so It is quite possible then to have a file opened in two different Temprecord data windows and to have data from that file displayed in each, but with two different sets of lower and upper limits, and these limits can be adjusted independently.
|
The datafiles saved from the Temprecord program "remember" the programmed limits of the logger as well as the settings of the display limits. These values are not necessarily the same. When data is read from a logger the display limits are set from the programmed limits for the logger, but when data read from a logger is saved to a .TRX file the logger upper and lower limits, and the display upper and lower limits, are both saved in the datafile separately. When data is read back from a .TRX file into the Temprecord program, the display limits are set to whatever they were set to when the file was saved. So the potential exists for the display limits (and therefore the statistical information that depends on the display limits) to be different to the logger's programmed limits.
|
|
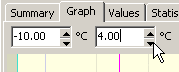
The appearance of the display limits controls alter according to whether they are set to the same value as the corresponding limit in the logger. For example, when the logger temperature lower and upper limits are the same as the logger's programmed limits, the controls appear as:
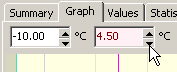
When a display limit is not the same as the logger's programmed limits, that control appears with pink background and red digits, i.e:
|