Temprecord Loggers > Operation of the G4 LCD logger
The G4 LCD Logger provides the same accuracy and resolution of its predecessors, with the added advantage of a custom Liquid Crystal Display (LCD). The LCD display provides the following additional features:
•Operations such as start, stopping and reusing the logger show visual feedback. •The last sampled temperature and/or humidity are shown on the display and are available at the press of a button. •Numerous additional screens are available which can display data such as minimum and maximum temperatures, mean temperatures, time outside limits, etc. •An indication of whether the temperature and/or humidity has exceeded the programmed limits. •An indication of the state of the battery. •An indication of whether loop overwrite is on or off.
The G4 logger is available in three variants:
•One temperature channel •One temperature channel, and one humidity channel •Dual temperature channels
The humidity is always measured by a sensor mounted inside the case, which has a grille to permit the sensor to be exposed to ambient conditions.
The temperature channel sensor can be internal, or mounted inside a specially designed probe. In the case of the Dual Temperature Logger, one sensor is inside the case, and one is in the probe. |
|
Under normal operation, pressing the button briefly moves between the various screens in the logger in a circular fashion, i.e. when the button is pressed while the last screen is displayed, the first screen (called the "home" screen) is displayed.
If the logger is left for more than a few seconds on any screen, it will revert to the home screen.
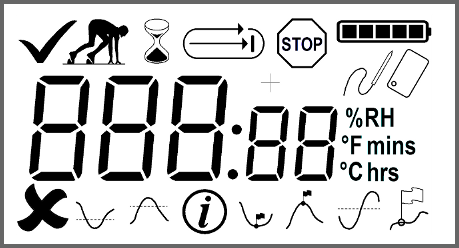
LCD Display
The following shows the LCD display with all symbols that can display. Some of the screen icons only have meaning in combination with other icons:
 prompt
|
No limits have been exceeded in the current trip. |
|
One or more limits have been exceeded. The limit(s) that has been exceeded is shown by the upper limit symbol and/or lower limit symbols. |
|
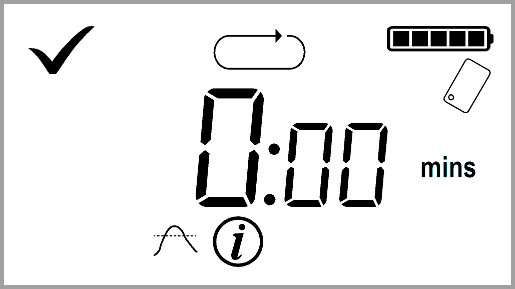
Logger is ready to be started. |
|
The logger is counting down the start delay. |
|
Loop overwrite mode ON. The logger will start to overwrite the oldest samples when it fills. If the logger is configured with overwriting enabled this symbol will display regardless of the operating state of the logger. If this symbol is displayed by itself, the logger is currently logging with overwrite enabled. |
|
Loop overwrite mode OFF. The logger will stop recording samples when it is full. If the logger is configured with overwriting disabled this symbol will display regardless of the operating state of the logger. If this symbol is displayed by itself, the logger is currently logging with overwrite disabled. |
|
The logger is stopped. |
|
Battery capacity indication. Each "bar" corresponds to roughly one-fifth of the logger battery capacity. The battery state is an approximation, but is conservative. The logger should not be used if the battery symbol shows no "bars", as there is a significant chance that the battery will be exhausted before the trip can complete. |
|
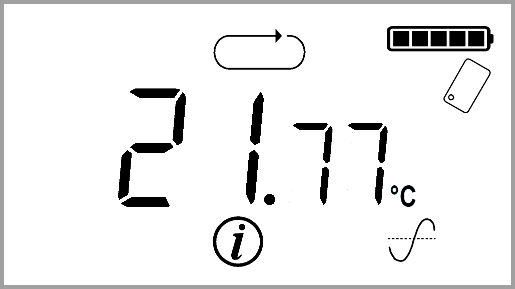
External sensor. The temperature or humidity displayed is from a sensor contained outside the logger (i.e. a probe).. |
|
Internal sensor. The temperature or humidity displayed is from a sensor contained inside the logger. |
|
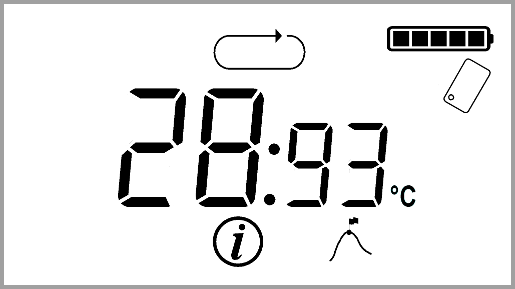
The lower limit has been exceeded. This symbol is also used when the information symbol is displayed to indicate that the value displayed (the time outside the lower limit) is associated with the lower limit . |
|
The upper limit has been exceeded. This symbol is also used when the information symbol is displayed to indicate that the value displayed (the time outside the upper limit) is associated with the upper limit |
|
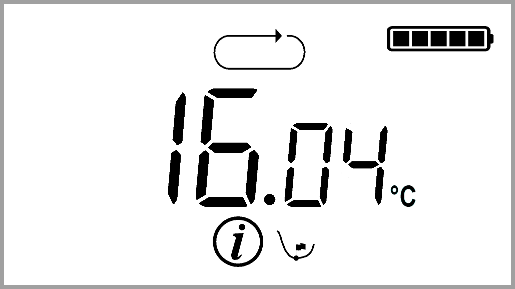
The current display is informational. The context of the display is given by other symbols (such as the upper and lower limit symbols) on the display |
|
The current display shows the minimum value of the samples taken so far. |
|
The current display shows the maximum value of the samples taken so far. |
|
The current display shows the mean value of the samples taken so far. |
|
A marker insertion is pending. The symbol will remain displayed until the next sample has been taken and the marker stored with it in the logger. This symbol also shows in combination with the information symbol when the display is showing the number of markers that have been inserted on the the current trip. |
%RH |
The value displayed is a relative humidity in percent. |
°C |
The value displayed is a temperature in degrees Celsius. |
°F |
The value displayed is a temperature in degrees Fahrenheit. |
mins |
The value displayed is a time in minutes and seconds. |
hrs |
The value displayed is a time in hours and minutes. |
Operating the G4 LCD Logger
The operation of the G4 LCD Logger is carried out by means of the button. The button is the only user control on the logger. By default the LCD display shows the most recent conversion value. Pressing the button moves you through various ancillary screens.
The display always returns to the default "home" screen after a short delay if no buttons are pressed. |
|

|
The button only requires moderate force to operate it. Never use an implement such as a pencil or other object to operate the button.
Remember that keeping the button pressed for more than a second or so is used to control starting, stopping, reusing, and the insertion of markers. Only keep the button pressed long enough to perform the desired operation, which will in most cases will be made obvious by a change in the display. |
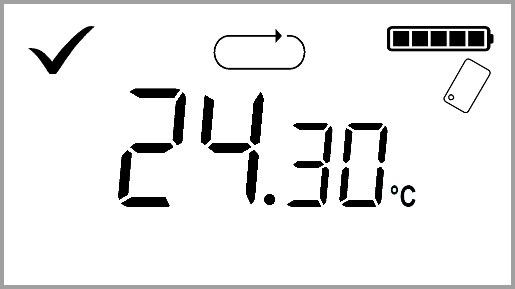
The "Home" Screen This screen displays by default after a period of 10 seconds. It always shows the most recent value of the first enabled channel, i.e. it will show the most recent temperature logged unless the logger is configured to log humidity only. |
|
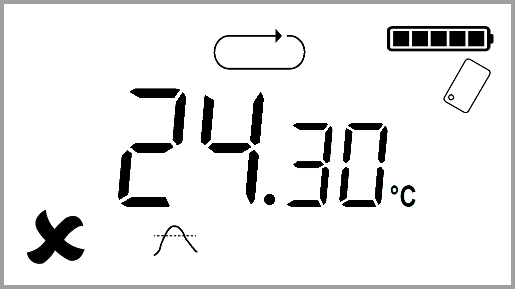
The "Home" Screen (when a limit has been exceeded) If a limit has been exceeded during the trip so far the display shows a cross rather than a tick, and a symbol on the bottom row indicates whether an upper or lower limit has been exceeded. |
|
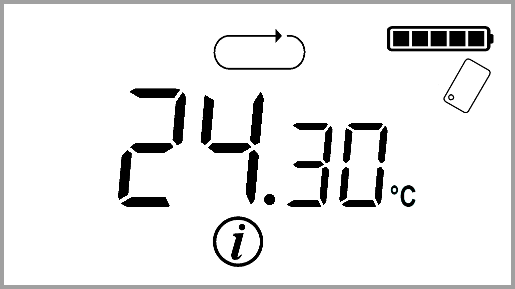
Last Results Pressing the button while the home screen is displayed causes the logger to show the last results screen. This is much like the home screen except there is no indication of whether the limits have been exceeded, and the display alternates between the enabled channels if more than one parameter is being logged.
|
|
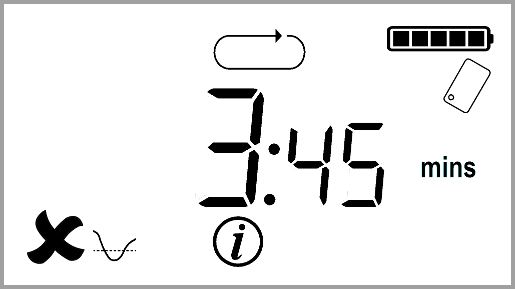
Lower Limit Pressing the button while the Last Results screen is displayed causes the logger to show the Lower Limit screen. The time below the lower limit (in minutes and seconds) is displayed. If the logger is configured to log more than one parameter the time outside the limit for each channel is displayed in turn .
|
|
Upper Limit Pressing the button while the Lower Limit screen is displayed causes the logger to show the Upper Limit screen. The time above the upper limit (in minutes and seconds) is displayed. If the logger is configured to log more than one parameter the time outside the limit for each channel is displayed in turn .
|
|
Minimum Pressing the button while the Upper Limit screen is displayed causes the logger to show the Minimum screen. The minimum temperature and/or humidity since the logger was started is displayed. If the logger is configured to log more than one parameter the minimum value for each channel is displayed in turn.
|
|
Maximum Pressing the button while the Minimum screen is displayed causes the logger to show the Maximum screen. The maximum temperature and/or humidity since the logger was started is displayed. If the logger is configured to log more than one parameter the maximum value for each channel is displayed in turn.
|
|
Mean Pressing the button while the Maximum screen is displayed causes the logger to show the Mean screen. The mean temperature and/or humidity since the logger was started is displayed. If the logger is configured to log more than one parameter the mean value for each channel is displayed in turn.
|
|
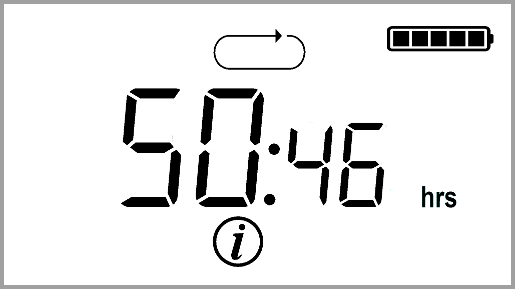
Elapsed Time Pressing the button while the Mean screen is displayed causes the logger to show the Elapsed Time screen. This is just the time that has elapsed since the logger started taking samples.
|
|
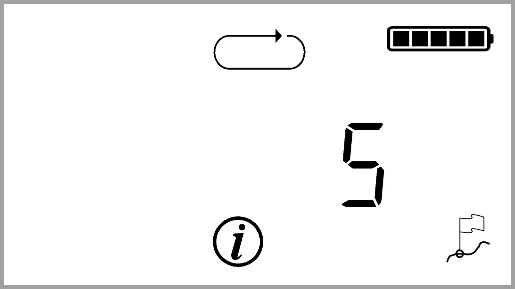
Markers Pressing the button while the Elapsed Time screen is displayed causes the logger to show the Markers screen. This is the count of markers recorded in the logger since the logger was started
Pressing the button while the Markers screen is displayed causes the logger to cycle back to the Last Results screen. |
|
|
The parameters time below lower limit, time above upper limit, maximum, minimum, mean, elapsed time, and total markers which are displayed by the logger are all calculated over the samples taken in the trip since the logger started sampling. If the logger is overwriting and is read with Temprecord, these statistics as reported by Temprecord and those as reported in these screens will not agree, because the samples read from the logger by the Temprecord program do not include those samples lost to overwriting, whereas the statistics displayed by the logger include these "lost" samples. |
|
If you wait for longer than ten seconds at any screen the display will revert to the home screen. |
See also