View Menu > Graph View > Copy to Excel
When you are in Graph view, you can use the Copy to Excel function to create a new Excel spreadsheet and place the selected sample values (samples between the start and end samples) into the spreadsheet. There are options that allow you to:
•include or exclude the date column.
•prompt for the filename of the XLS file, or default to using a file with thee same name as the .TRX file, but with an extension of .XLS
•prompt before overwriting an existing XLS file of the same name.
•open the XLS file with Microsoft Excel after it is created (requires Excel to be installed on the computer).
|
The explanation below is for copying a range of samples directly to Excel. To copy a range of times/samples to other applications, such as Microsoft Word, see the Copy to clipboard function. |
To copy a range of samples to Excel, follow the steps below:
•In Graph view, select the start sample on the trace of the range you wish to transfer. Click on the sample, and then press the F7 key.
•Now select the end sample of the range. Click on the sample, and press the F8 key. The range of samples selected is shown on the graph in a different colored background.
•If you want to copy all the samples into the spreadsheet, type Ctrl-A to select all the samples.
•Open the Graph right-click menu by clicking the right-hand button on your mouse.
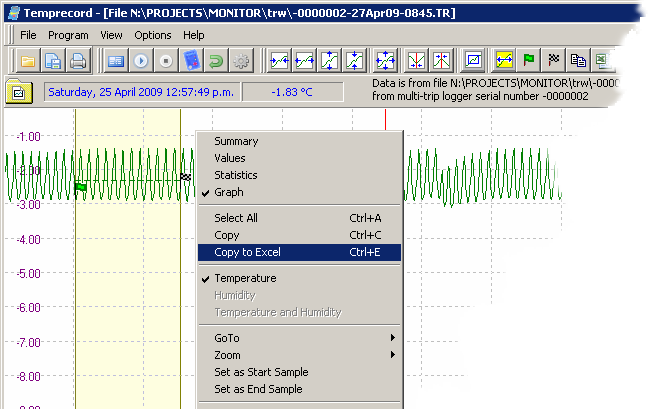
•Select Copy to Excel from the menu.
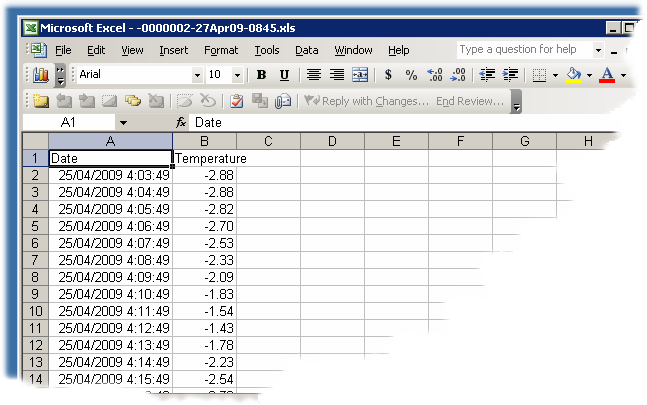
The data will be pasted into the spreadsheet as one to three columns:
1.The date and time of the sample. This column can be suppressed if required.
2.The temperature of the sample (in the selected display units) if temperature was logged.
3.The humidity of the sample, if humidity was logged.
The temperatures will be copied in the current display units (C or F).
|
You can also use the Ctrl-E key or the Copy to Excel speed button |
|
When Temprecord copies your data to an Excel spreadsheet, it makes choices for you as to how the data should be displayed. You can alter these formatting choices on your spreadsheet if you wish but there should be no need to do so.
•When a temperature or humidity value is copied to the spreadsheet, the display format is set to 2 decimal places. Temprecord uses a format specifier of "0.00" for these cells. •When a date is copied to the spreadsheet, the display format is set to show the date according to the users local regional settings short date format, and the time as a fixed setting. Temprecord uses a format specifier of "<users short date format> hh:mm:ss AM/PM" for these cells. •When a duration is copied to the spreadsheet, the display format is set to show the duration in hours, minutes and seconds, with the number of hours increasing past the value of 24 as necessary. For example: •Any other field copied to the spreadsheet that is not one of the above formats is generally a string (a collection of characters) and the display format is set to "general".
Note that dates and durations are represented within Excel as numbers, being the number of days for durations, and the number of days since 31 December 1899 for dates. Although these dates and durations are displayed in non-numeric formats, you can still reference the cell as a value if you wish and use dates and durations in calculations. |
See also: