View Menu > Graph View > Zoom Functions > Zooming with the mouse
Using the mouse it is possible to zoom in about an arbitrary area of the graph.
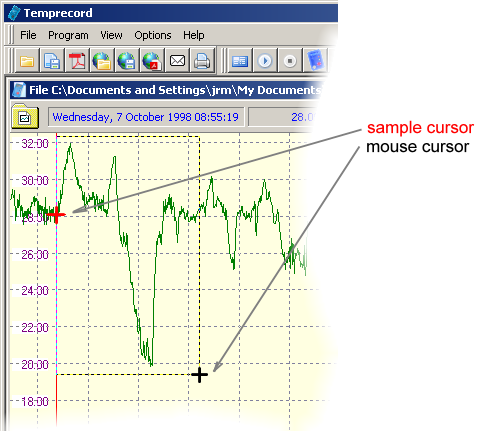
To zoom with the mouse you mark the area of the graph you wish to zoom about by clicking and dragging with the mouse with the Ctrl key pressed.
•Press the Ctrl key and keep it pressed
•Click at the top-left corner position of the rectangular area on the graph you wish to zoom about. The cursor will change from a cross-hair to 
•Holding the Ctrl key and the mouse button down, "drag" the mouse cursor to the bottom-right corner position of the desired zoom area. The active zoom area will be shown on the graph as a dotted rectangle.
•Release the mouse button. The graph view will change to show only that portion of the graph that you marked out with the mouse.
•release the Ctrl key
The area displayed on screen will be changed to be the same as that area described by the zoom function.
|
If you don't press the Ctrl key, instead of zooming, dragging the mouse cursor will carry out a "pan" operation, that is, the graph will "drag" along with the mouse cursor. |
|
If you change your mind you can abandon the zoom with the mouse operation in one of two ways: •release the Ctrl key before you release the mouse button. •make the zoom are as small as possible and then release the mouse button. The current zoom settings will not be changed. |
|
You can quickly return the graph view to show all of the trace by pressing the F4 (Zoom All) key or by clicking the Zoom All
|